
The Reporting page provides comprehensive insights into flow executions, document generation, and user activity within a project. It helps administrators monitor performance, analyze usage trends, and export execution data using dashboards, filters, and custom reporting views. There are two main sections:
-
Monitoring - The Monitoring data is intended to troubleshoot operational issues and provides full insight into recent activity. This data is cleared by the clean-up service. The following sections are available under Monitoring.
-
-
Flow runs overview
-
Recent flow runs
-
Documents overview
-
-
Reporting - The Reporting section provides insights into product adoption and utilization. This data provides less detail, but is not cleared by the clean-up service and allows administrators to discover trends over a longer period of time. The following Categories are available under Reporting.
-
User statistics
-
DPU consumption
-
Flow utilization
-
Template utilization
-
Flow runs overview
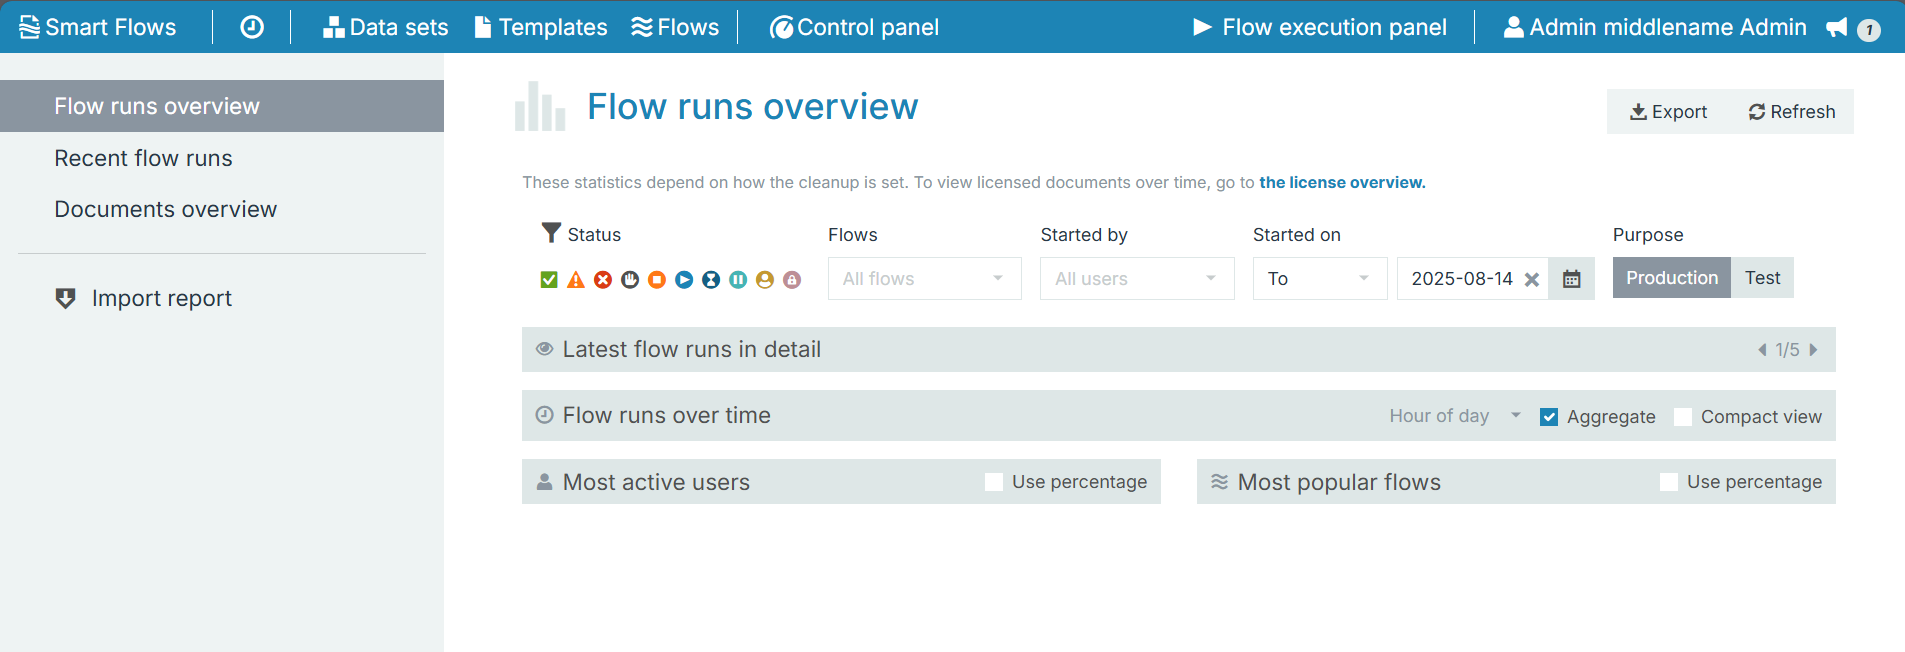
The Flow runs overview page provides an overview of all the flows executed. This includes recent and overall flow executions, users who executed the flows, and commonly used flows.
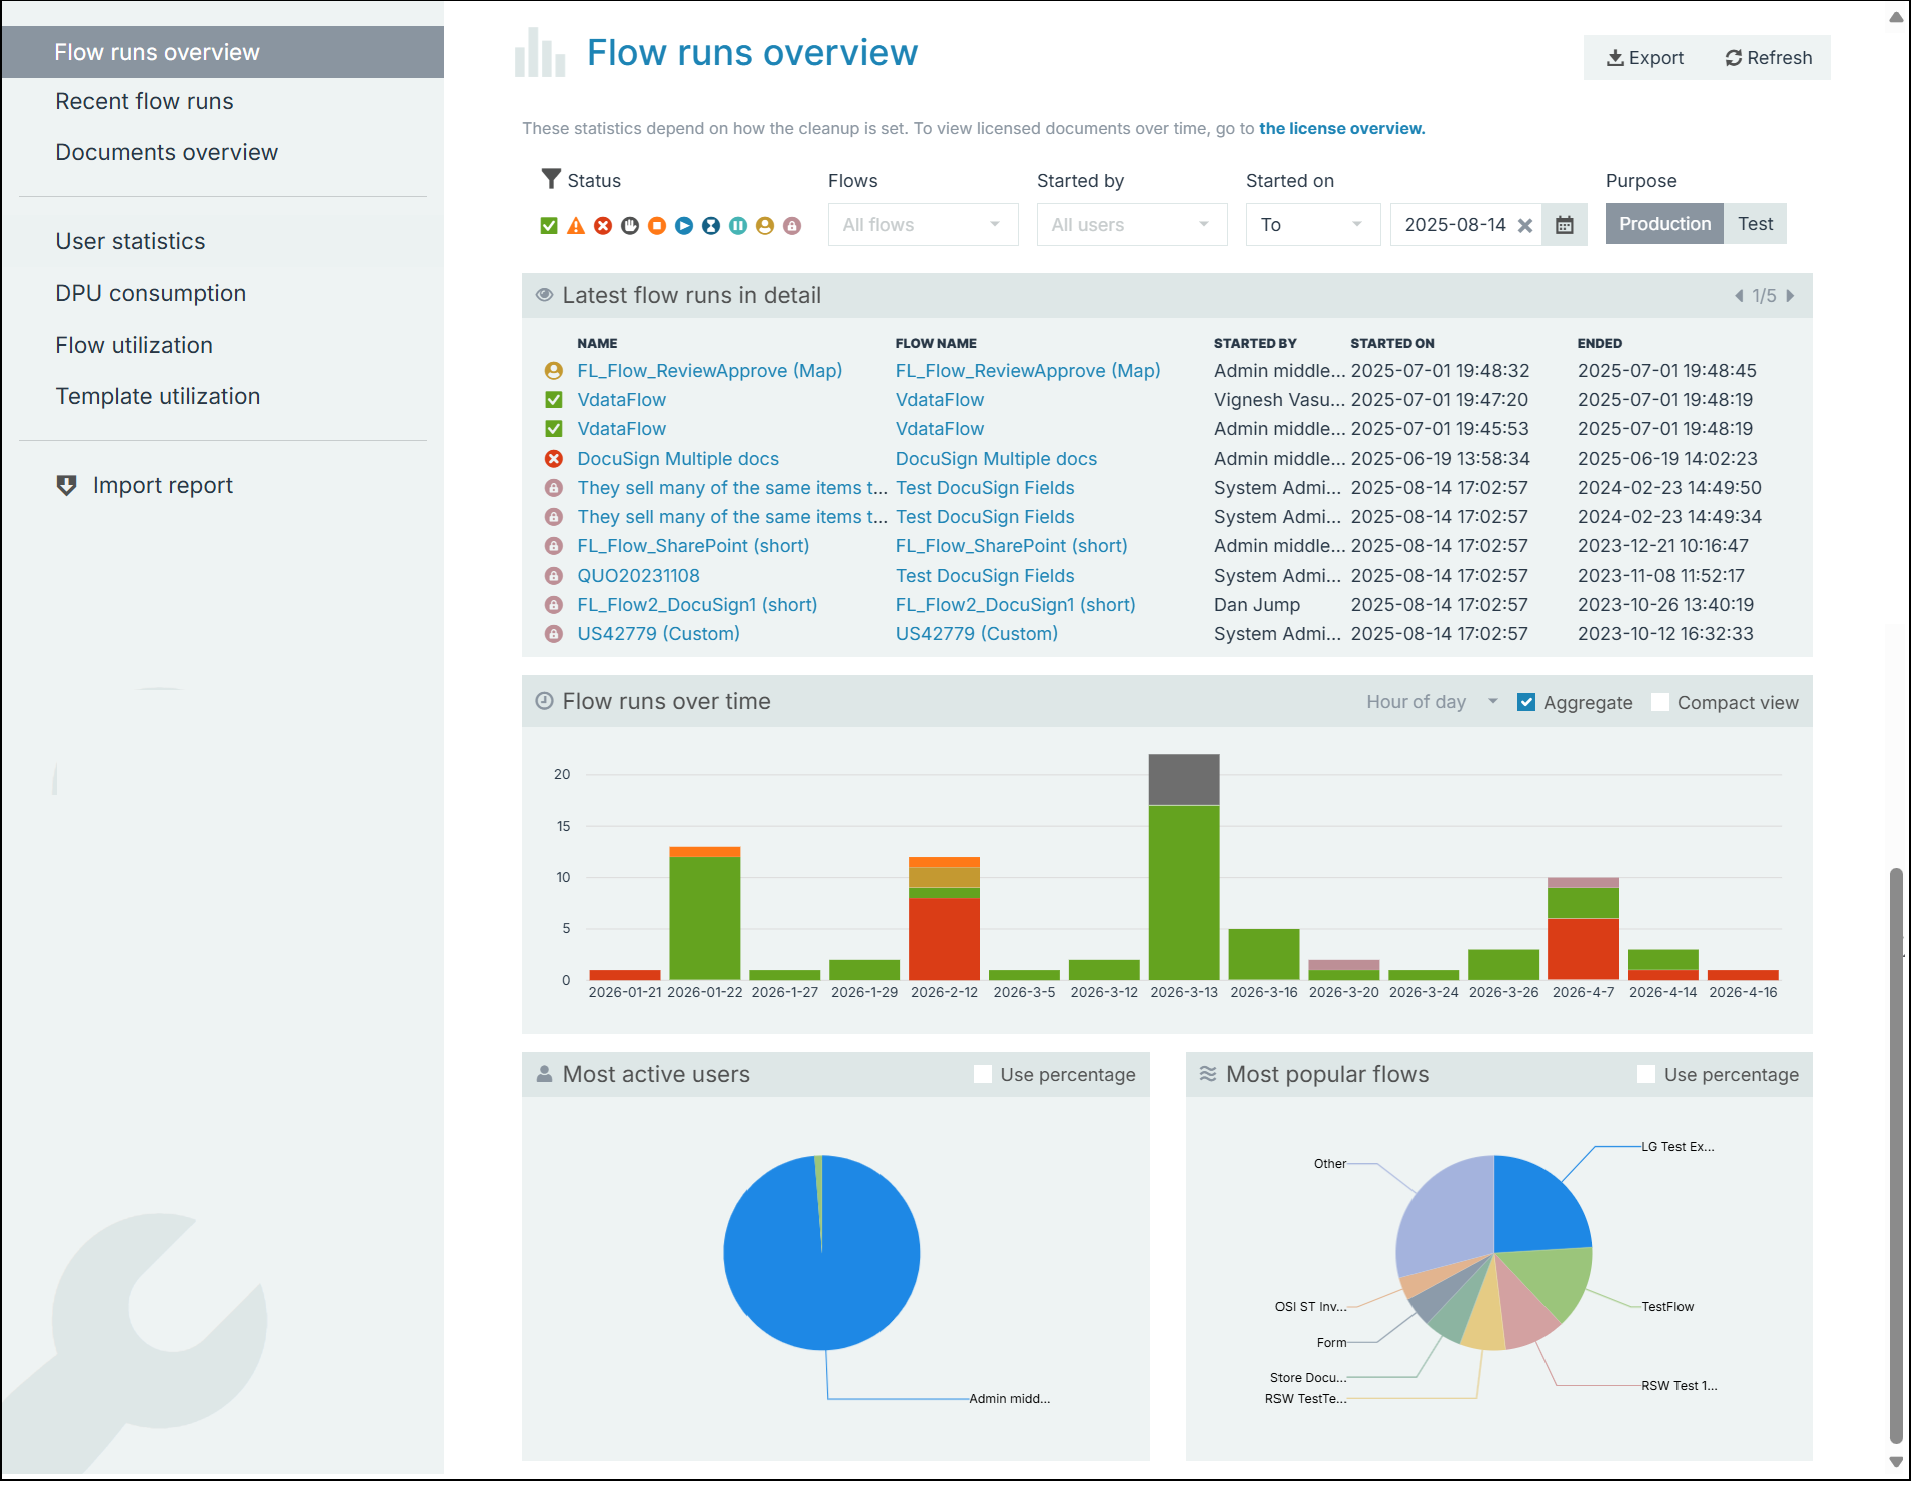
Latest Flow Runs in Detail🔗
-
The Latest flow runs in detail provide information such as the flow name, the user who initiated the flow, the start and end times of the flow, and the flow execution status.
-
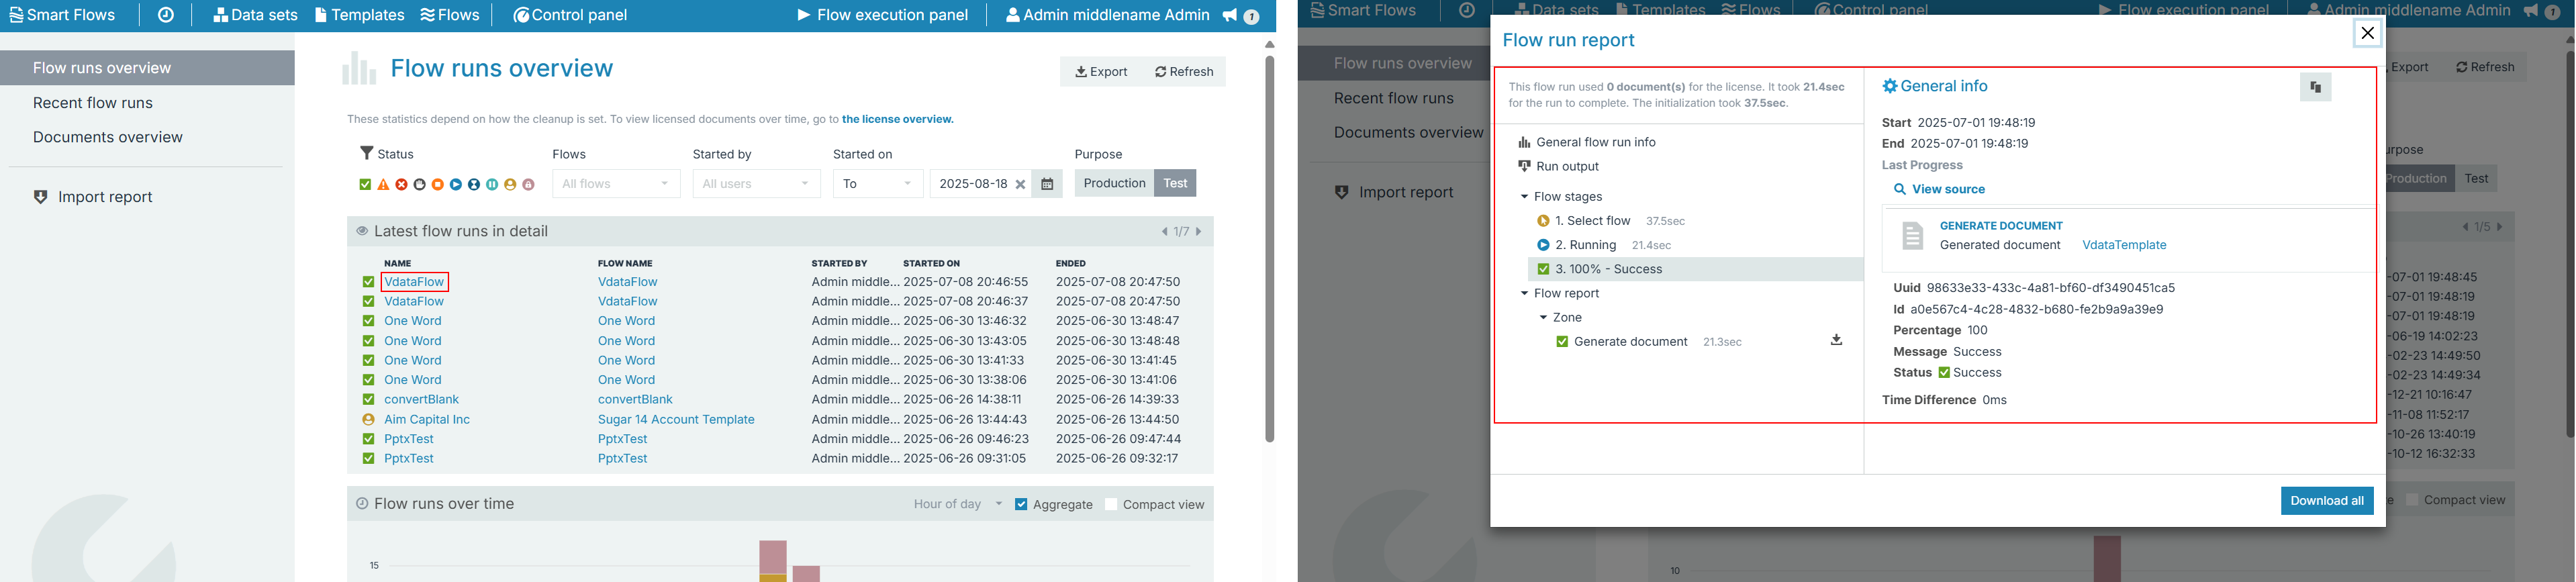
Select the flow name to view a Flow run report dialog box displaying end-to-end details of the flow execution. This includes information such as the generated document, flow ID, flow status, flow stages, flow output, and all the attempts made to execute the flow.
-
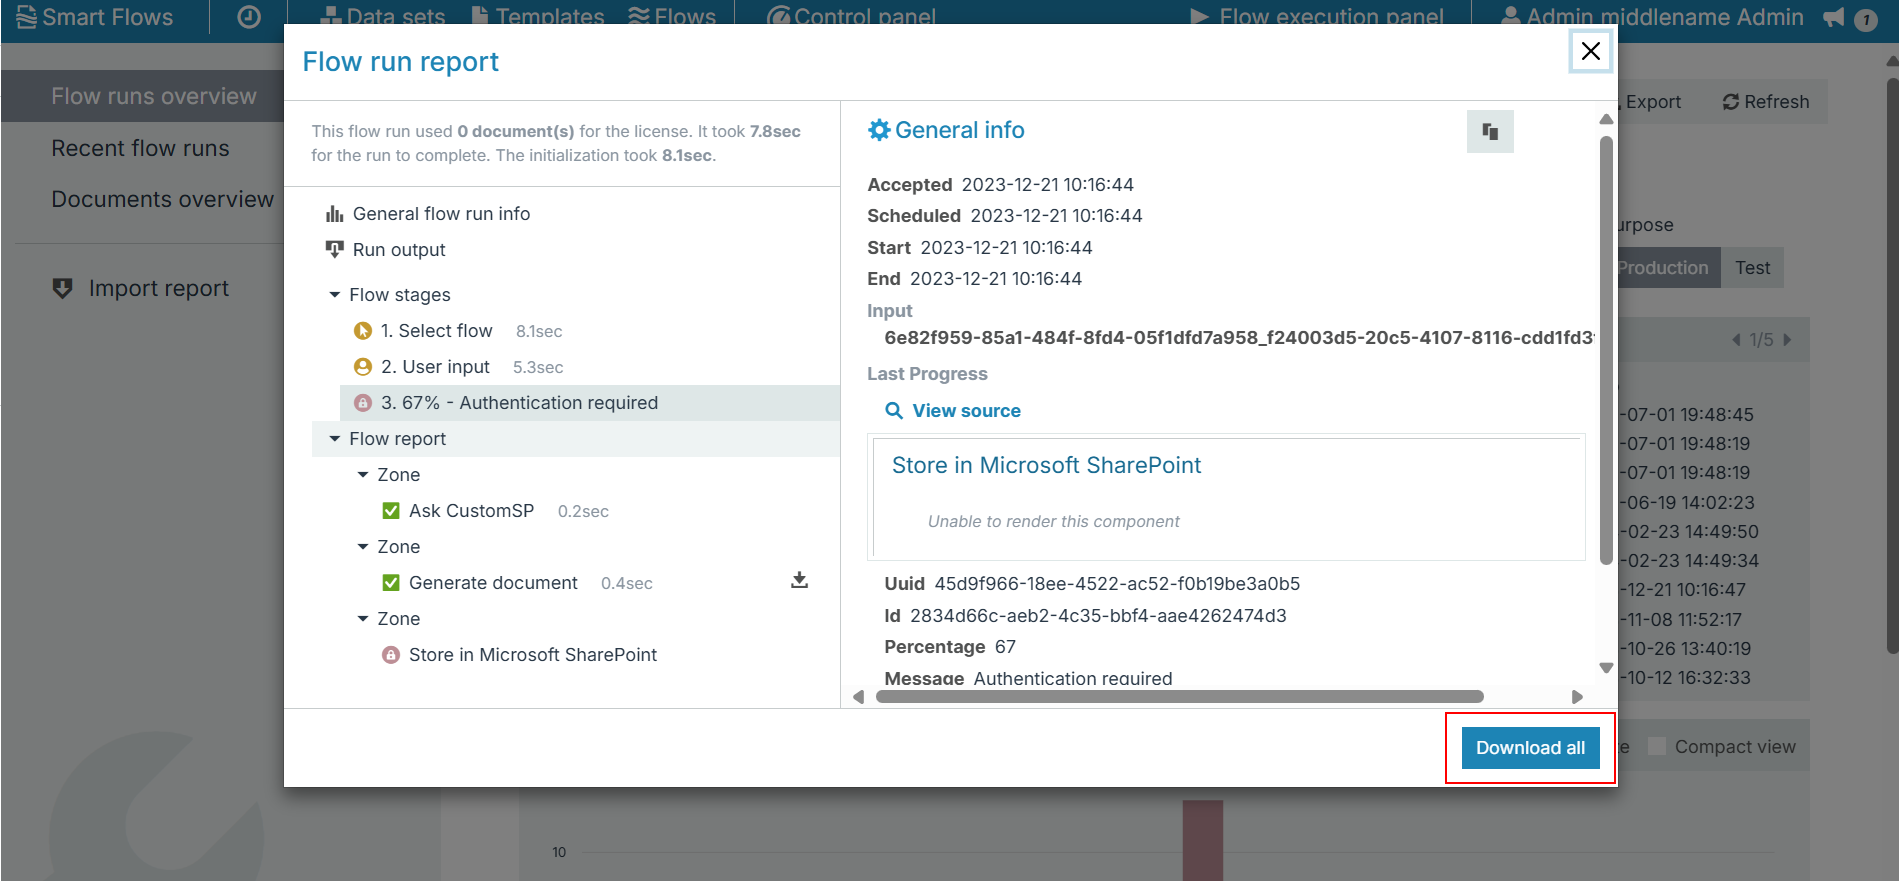
Select Download to download a JSON file containing all the information about the flow run. This also includes valuable information for the support team to troubleshoot and determine the specific cause of any issues that may have occurred during the execution.
Flow runs overtime
The Flow runs overview page provides an overview of all flows executed. This includes recent and overall flow executions, users who executed the flows, and commonly used flows.
-
The Flow runs over time dashboard displays a bar chart of all the flows executed over a period of time. The flow runs are color-coded according to the flow execution status.
-
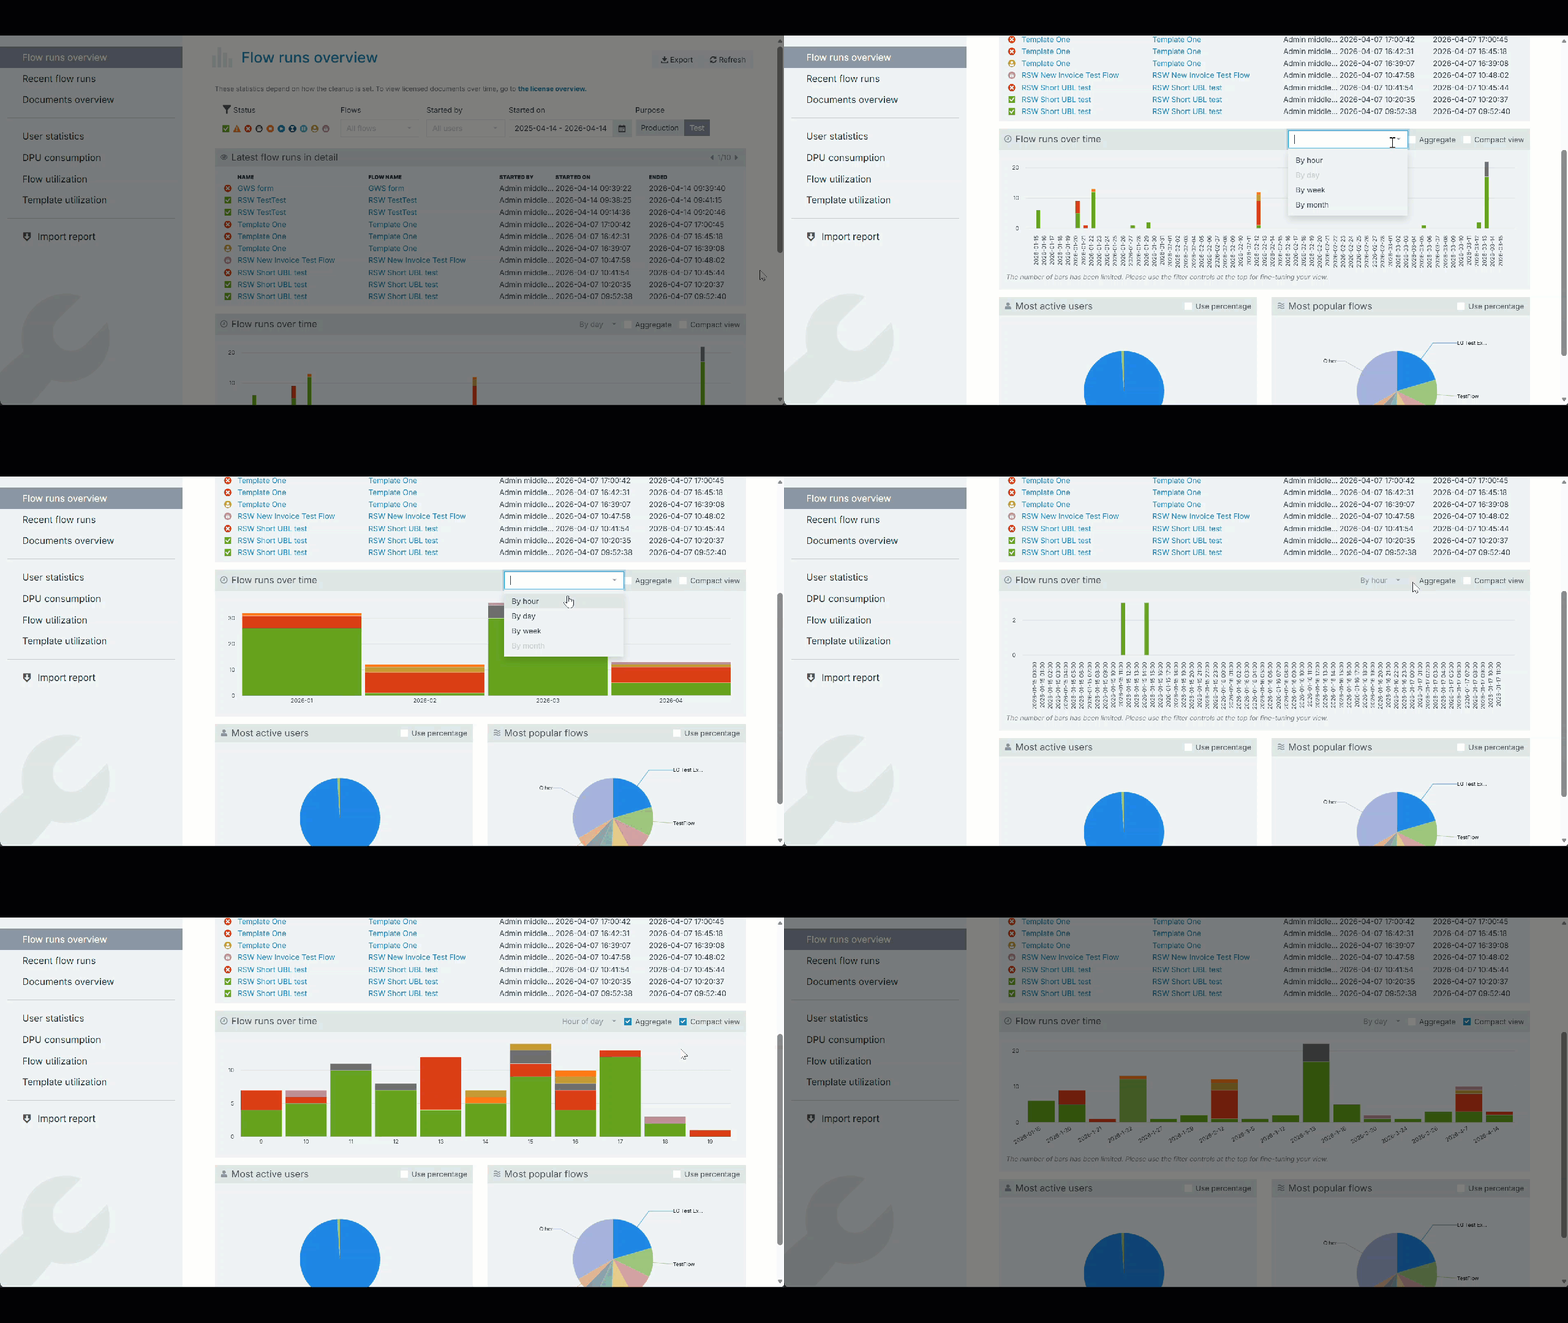
Filters and view customization:
-
-
Time - (Hours per day) - Displays flow runs based on time intervals. displays
-
Compact View - Displays the graphs without empty space, showing more data.
-
Aggregate View- Aggregate helps determine peak periods. It groups flow runs at a specific time. For instance, all flow runs on Monday, or all flow runs at 10 am.
-
Users
-
The Most active users dashboard displays a pie-chart that shows every user's share of total flow runs.
-
The Most popular flows dashboard displays a pie-chart that shows every flow's share of total flow runs.
-
Hover over a segment to see the total number of flow runs for that user.
-
Select Use percentage checkbox to view the percentage of flows for that user compared to the total number of flows.
Select the title to collapse the above statistics dashboards.
Recent flow runs
-
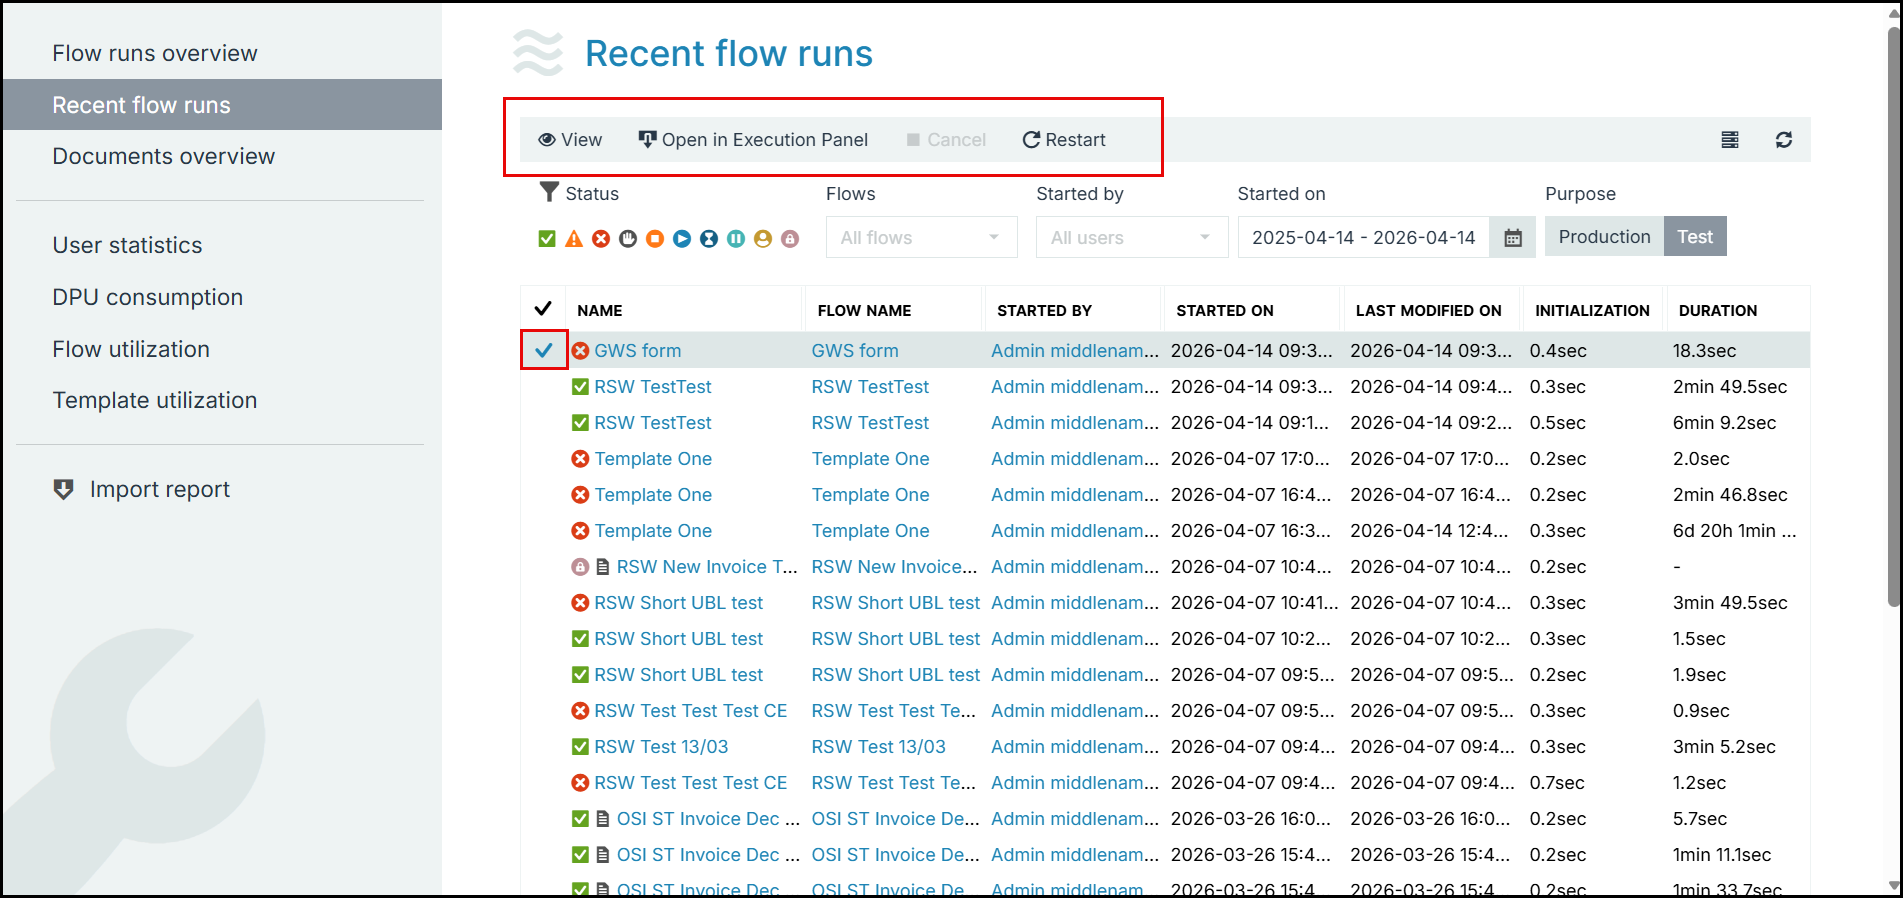
The page displays a list of flows executed recently.
-
Select a flow to view a few actions enabled based on the status the flow belongs to.
-
-
View - Select View to open the Flow run report dialog box.
-
Open in Execution Panel - Select Open in Execution Panel to open the Flow Execution Panel in a separate tab, allowing administrators to see the end user's view of the execution.
-
Depending on the flow status, the other two actions —Cancel and Restart— are enabled. Flow executions in an unfinished state can be canceled (e.g., when they are stuck in a particular state). Flows in an unsuccessful finished state can be restarted (e.g., to restart the execution of a failed or interrupted run after the cause of failure has been fixed).
-
You can customize the list view by selecting columns from the column selector icon


-
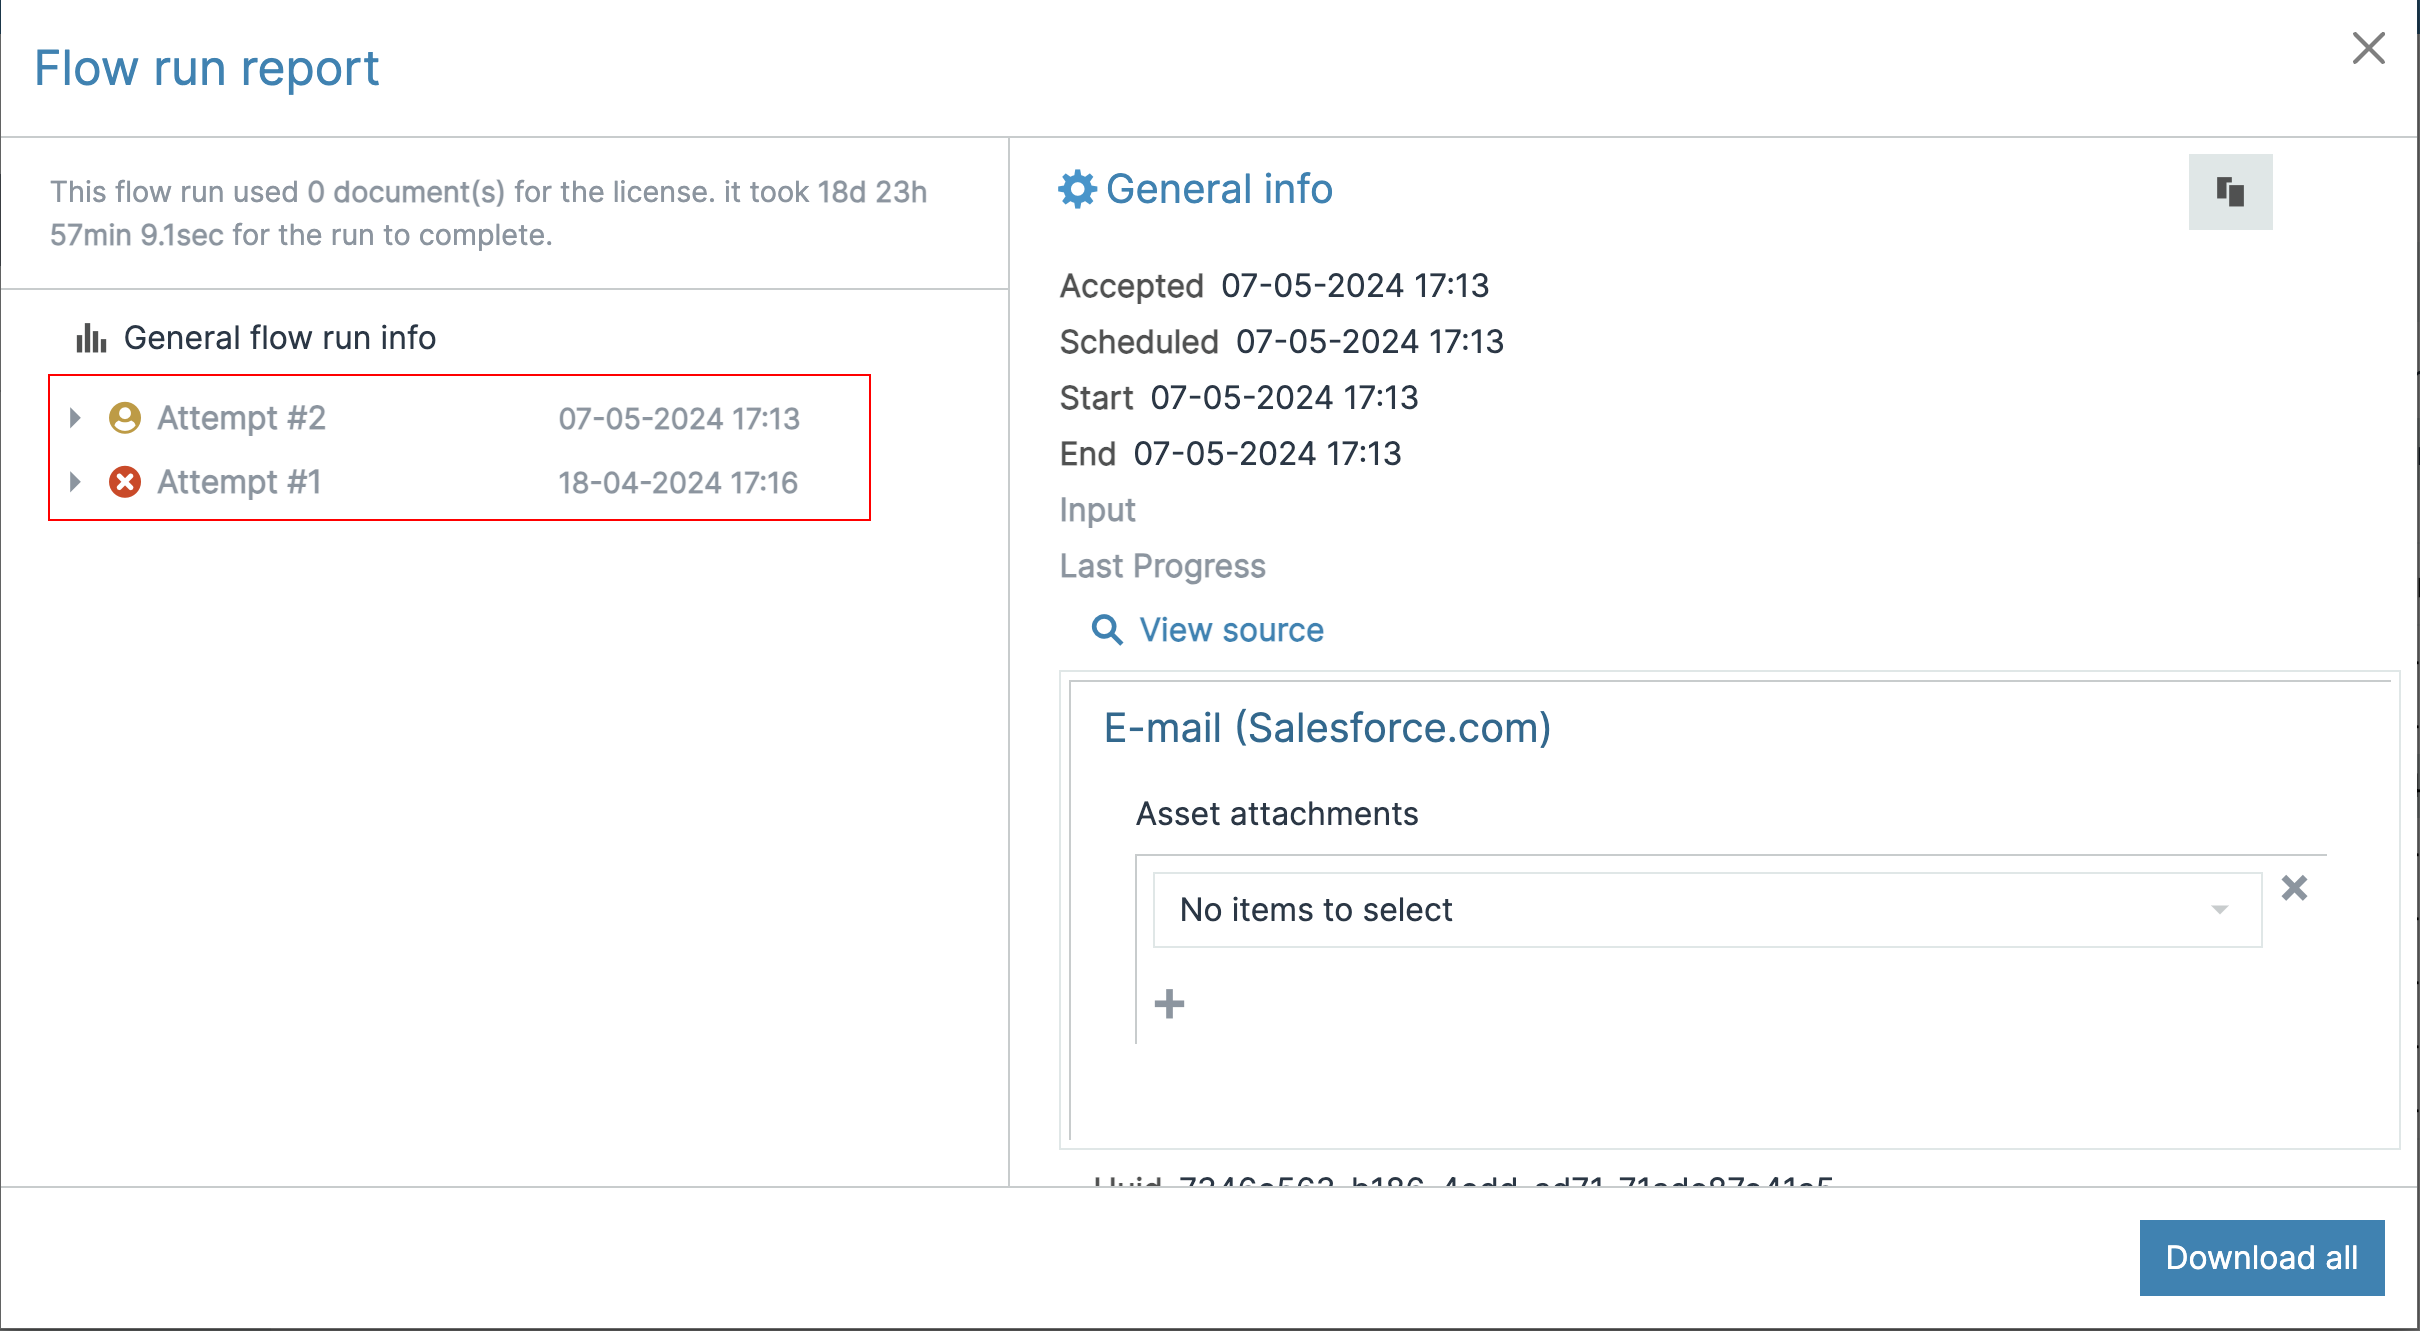
You can restart flow executions with a status of Error, Canceled, Warning, or Interrupted. On the Recent flow runs page, select a run and choose Restart.
-
-
If you have more than one attempt you can see the information about each attempt inside the View pane on the left.
Documents overview
-
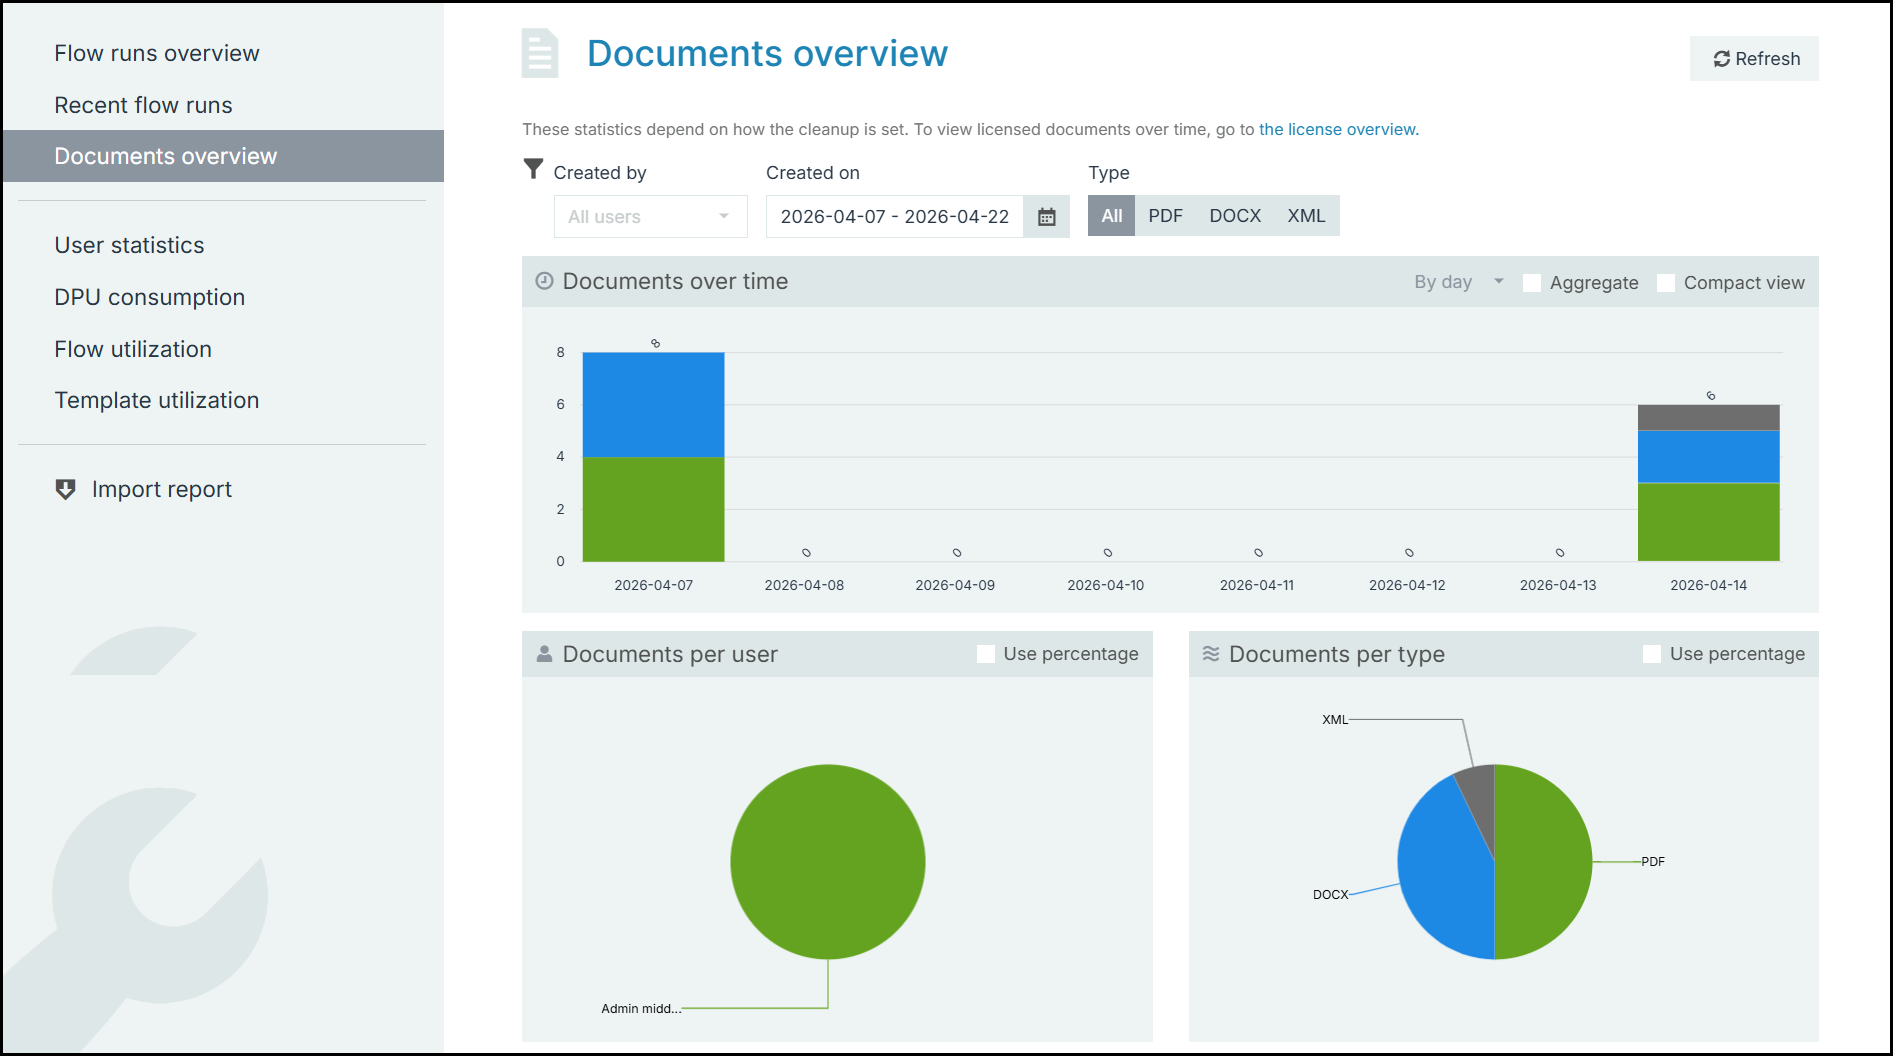
The Documents overview page gives a report on the documents generated.
-
You can filter the documents based on the user who initiated the flow, the start and end dates of the flows (that generated documents), and document types.
-
The Documents over time dashboard displays all documents generated over a period in a bar chart. You can select time intervals from the dropdown and choose to view the documents in Aggregate or Compact view.
-
The Document per user dashboard displays the total number of users who have generated documents in a pie-chart. The Documents per typedashboard displays the total number of documents generated in a particular type (PDF, DOCX, XML, etc).
Filters
Refine the data using the following filters:

|
No. |
Filters |
Description |
|---|---|---|
|
1. |
Status |
Filter the reports based on the flow execution status; success, warning, error, interrupted, canceled, running, waiting, queued, user input, and authentication needed. |
|
2. |
Flows |
Filter the reports based on the Flow Name. |
|
3. |
Started by |
Filter the reports based on the user who initiated the flows. |
|
4. |
Started on |
Filter the reports based on the time period. Select the calendar icon to view the "Select a date range" dialog box. You can select the time range mentioned on the left section or directly select the start and end date from the calendar. 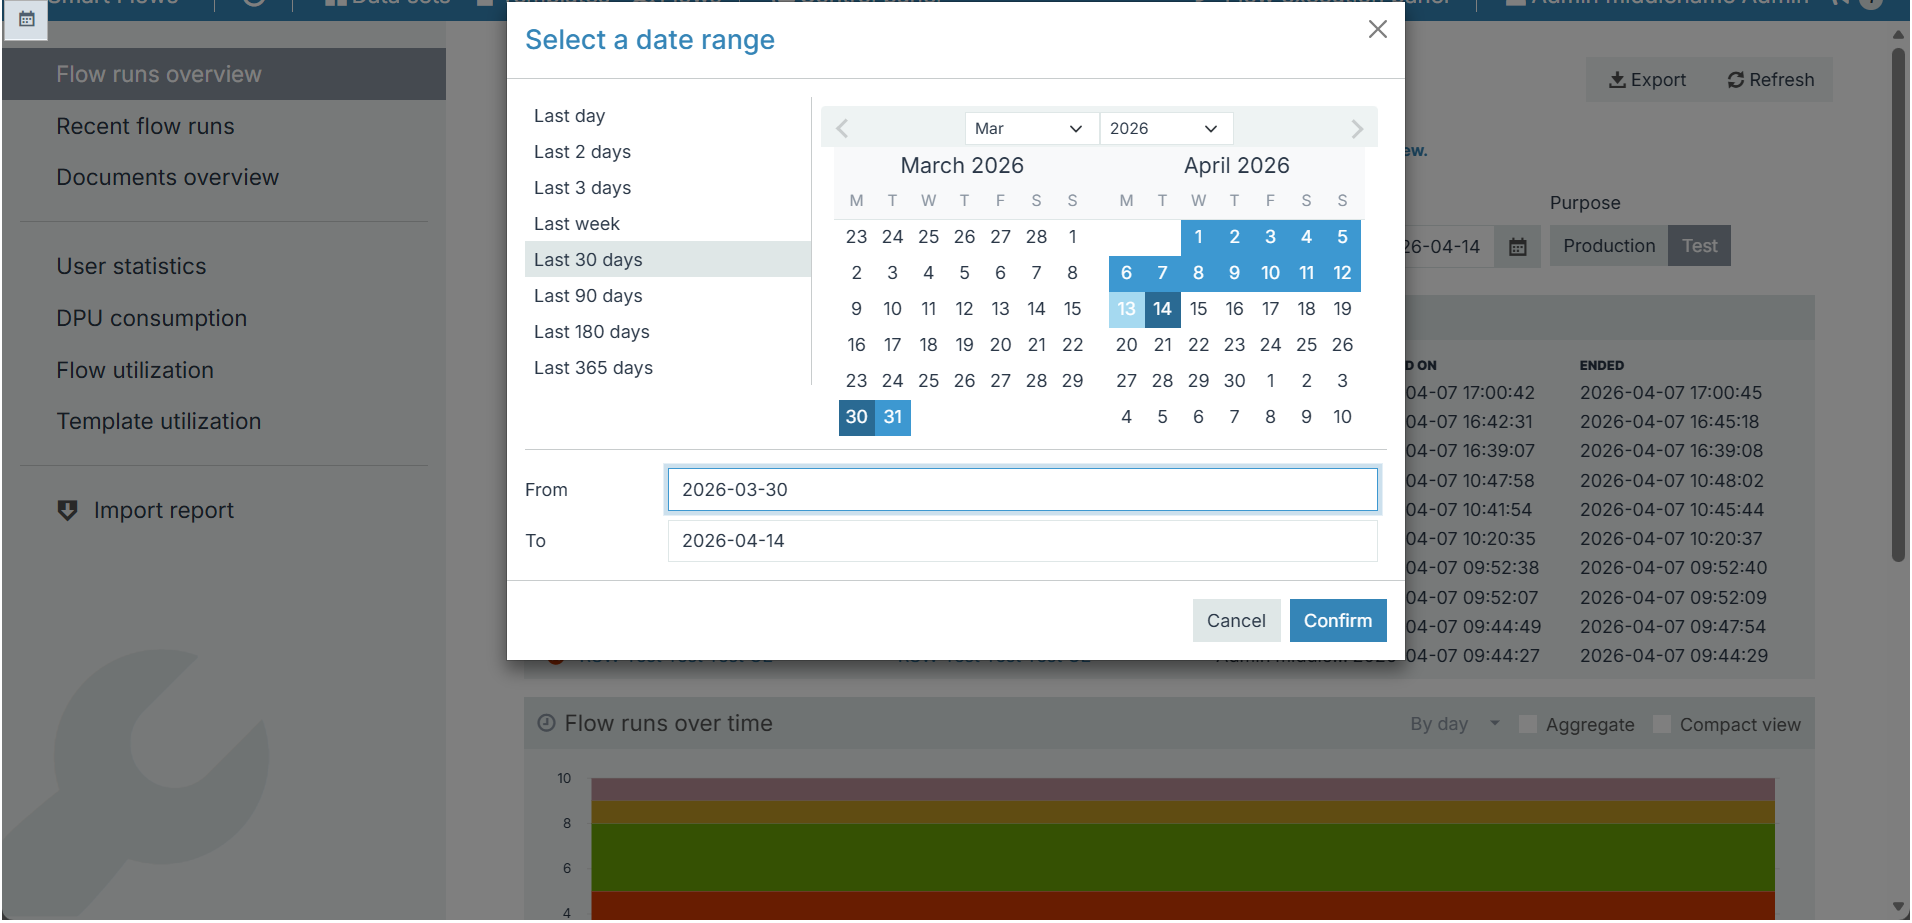
|
|
5. |
Purpose |
Filter the reports based on environment; Production and Test. |
-
Export the flow executions run within the project into a single file (.csv). You can either download all the reports or refine them using the filters enabled in the Export Flow Execution dialog box.
-
If you select All in the Export Flow Execution dialog box, enter the flow name, and check Include flow execution state (optional) to view execution details, generated document information, the JSON payload, and runtime details.
-
In case you select Apply Filters, the filters are similar to the Filters explained in the above table. Apply the filters as per business requirements and export the file.
-

Categories
Experlogix Smart Flows provides four reporting categories to track: user login, document generation, flow execution, and template usage. They enable users to create custom views and gain actionable insights based on key attributes such as time, environment, usage patterns, and user details. The table below gives a detailed description of each statistic page and lists all the corresponding supported fields:
|
Statistic Type |
Description |
Supported fields |
|---|---|---|
|
User statistics |
The User Statistics page allows you to track all the user login events. You can create custom reporting views based on User Name,Tags, User ID, and Time Period. For example, you can create a reporting view that lists all users who initiated flows from France within a selected time range. |
|
|
DPU consumption |
The DPU Consumption page allows you to track all events that consumed Document Processing Units. Each document generated counts as one DPU. You can create custom reporting views based on Time of document generation, document name and type, number of DPUs consumed, environment (Test or Production), associated template, user details, and so on. |
|
|
Flow utilization |
Flow utilization page lists all the flows execution events in the current project. You can create custom reporting views based on attributes such as the flow initiation time, environment (Test or Production), flow triggers (for example, connectors), and executor tags. |
|
|
Template utilization |
Template utilization lists all the document generation events. You can create custom reporting views based on attributes such as Template, name, type, tags, language, output format, and user details. |
|
Based on the above categories, users can create custom reporting views. For more information, see Create Reporting View.
Below are the common actions that users can perform across all the category pages:
-
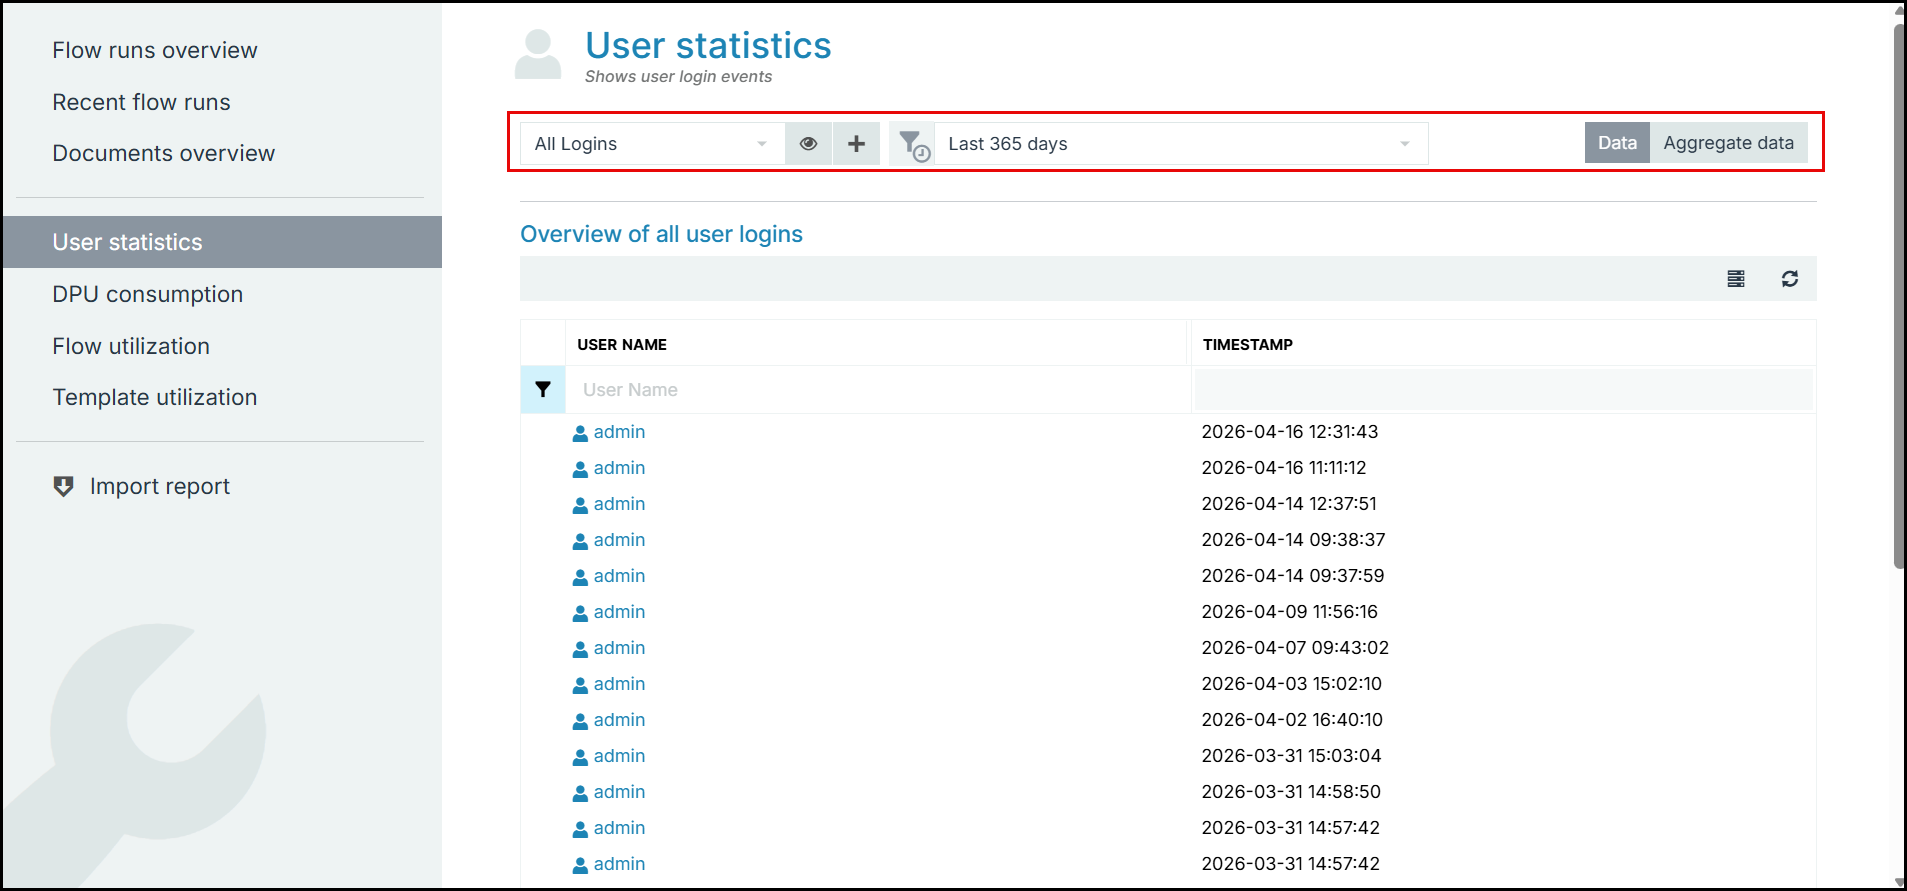
Name - Select the dropdown icon to select a reporting view created under the corresponding category. If the view is created by the current user, the Edit icon is displayed beside it. If it is a system view, then the View icon is displayed.
-
View - Select the icon to display the fields used in the current reporting view. System views are displayed in read-only mode, whereas custom views are displayed in edit mode.
-
Create View - Select the '+' icon to create a new reporting view. For more details, see Create Reporting View.
-
Duration - Select the drop-down icon to select the different time duration (last hour, last four hours, last week, last 365 days, etc) and filter the view.
-
Data & Aggregate -
-
Select Data to view the report data in list format.
-
Select Aggregate to view reports in different groups; for example, you can view the DPU consumed per document or the list of templates associated with each document name. This includes bar chart, pie-chart, pie-grid, and tree-map.
-
-
Export - Select Export button to download the data of the current reporting view.
-
The export contains the columns of the reporting view that is currently selected, and respects the filter defined in that view.
-
The selected Duration is applied to the export, so only the records within that time range are included.
-
The file is downloaded through your browser as a semicolon-separated .csv file, which opens directly in Microsoft Excel and can be imported into other reporting tools.
-
The export always contains the detailed records of the view. To export a different set of columns or a different selection of records, select or create the reporting view you need first, and then select Export.
-